-
Notifications
You must be signed in to change notification settings - Fork 6
Expand file tree
/
Copy pathREADME.md.in
More file actions
212 lines (151 loc) · 8.42 KB
/
Copy pathREADME.md.in
File metadata and controls
212 lines (151 loc) · 8.42 KB
1
2
3
4
5
6
7
8
9
10
11
12
13
14
15
16
17
18
19
20
21
22
23
24
25
26
27
28
29
30
31
32
33
34
35
36
37
38
39
40
41
42
43
44
45
46
47
48
49
50
51
52
53
54
55
56
57
58
59
60
61
62
63
64
65
66
67
68
69
70
71
72
73
74
75
76
77
78
79
80
81
82
83
84
85
86
87
88
89
90
91
92
93
94
95
96
97
98
99
100
101
102
103
104
105
106
107
108
109
110
111
112
113
114
115
116
117
118
119
120
121
122
123
124
125
126
127
128
129
130
131
132
133
134
135
136
137
138
139
140
141
142
143
144
145
146
147
148
149
150
151
152
153
154
155
156
157
158
159
160
161
162
163
164
165
166
167
168
169
170
171
172
173
174
175
176
177
178
179
180
181
182
183
184
185
186
187
188
189
190
191
192
193
194
195
196
197
198
199
200
201
202
203
204
205
206
207
208
209
210
211
212
<!--
| ̄ ̄ ̄ ̄ ̄ ̄ ̄ ̄ ̄ ̄ ̄|
| Don't edit |
| README.md directly!|
|___________|
(\__/) ||
(•ㅅ•) ||
/ づ
It will be overwritten by bin/gen_docs.sh.
Instead:
1. edit README.md.in
2. run $ bin/gen_docs.sh
-->
# Taiga Stats - Your Taiga Statistics Tool [](https://x.com/intent/tweet?text=Scrum%20and%20Kanban%20masters;%20generate%20statistics%20from%20your%20Taiga.io%20projects%20with%20this%20python%20tool&url=https://github.com/erikw/taiga-stats&via=erik_westrup&hashtags=taiga,scrum,kanban,statistics)
[](https://badge.fury.io/py/taiga-stats)
[](https://pepy.tech/project/taiga-stats)
[](https://taiga-stats.readthedocs.io/)
[](#)
[](https://github.com/erikw/taiga-stats/actions/workflows/ci.yml)
[](https://github.com/erikw/taiga-stats/actions/workflows/linter.yml)
[](#)
[](#)
[](#)
[](https://black.readthedocs.io/en/stable/the_black_code_style/current_style.html)
[](https://github.com/erikw/taiga-stats/blob/main/LICENSE)
[](https://github.com/Netflix/osstracker)
[](https://github.com/erikw/taiga-stats/tags)
<p align="center">
<!-- Ref: https://dev.to/azure/adding-a-github-codespace-button-to-your-readme-5f6l -->
<a href="https://github.com/codespaces/new?hide_repo_select=true&ref=main&repo=47283228" title="Open in GitHub Codespaces" ><img alt="Open in GitHub Codespaces" src="https://github.com/codespaces/badge.svg"></a>
</p>
This is a script for all you Scrum||Kanban masters out there who use Taiga and are interested in visualizing progress and generating some automated statistics and graphs.
[Taiga](https://taiga.io/) is an open-source virtual Scrum and Kanban board that is popular for managing projects and work. We use a physical whiteboard at work, but I mirror the status of stories in Taiga so that I can collect some statistics and generate diagrams and graphs using this tool I wrote.
# Features
```console
$ taiga-stats --help
<insert-helptext-here>
```
# Terminology
* *US* - User Story
* *CFD* - Cumulative Flow Diagram
## Cumulative Flow Diagram
From a [CFD](http://brodzinski.com/2013/07/cumulative-flow-diagram.html) a lot of interesting insights about your team's progress [can be found](http://paulklipp.com/images/Interpreting_a_Cumulative_Flow_Diagram.jpg). However, I'm not a fan of repetitive work like counting and entering numbers in an Excel sheet. This had to be automated! Therefore I deiced to write this script to save data on a daily basis with a cron job and a function for generating this diagram. This diagram can the be put on a TV visible in the hallways.
This is an example diagram generated from [mock data](https://github.com/erikw/taiga-stats/tree/main/sample_data/cfd_example.dat):
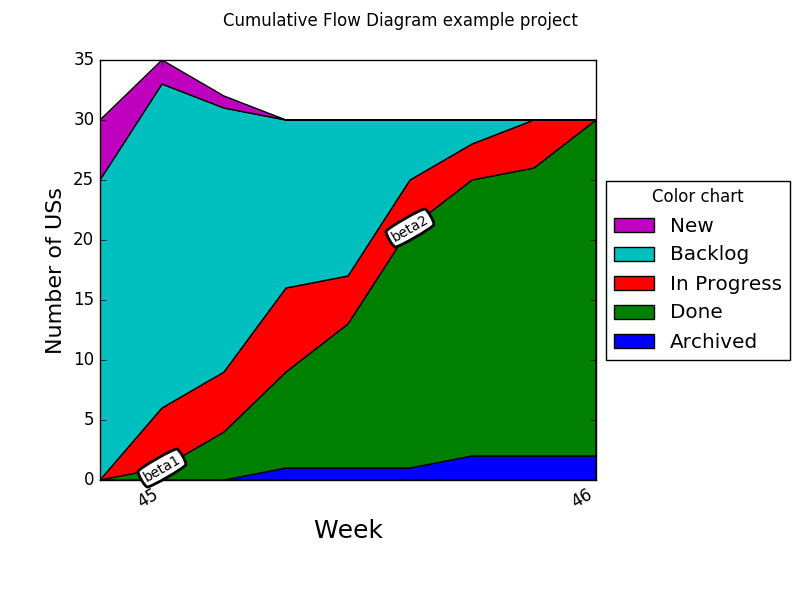
Textual annotations can be put in the plot by manually editing the `.dat file`.
Also, a target date for the project deadline can be specified. Then a line will be drawn showing the ideal work pace towards this date, as seen below, where the target finish date is in week 46.
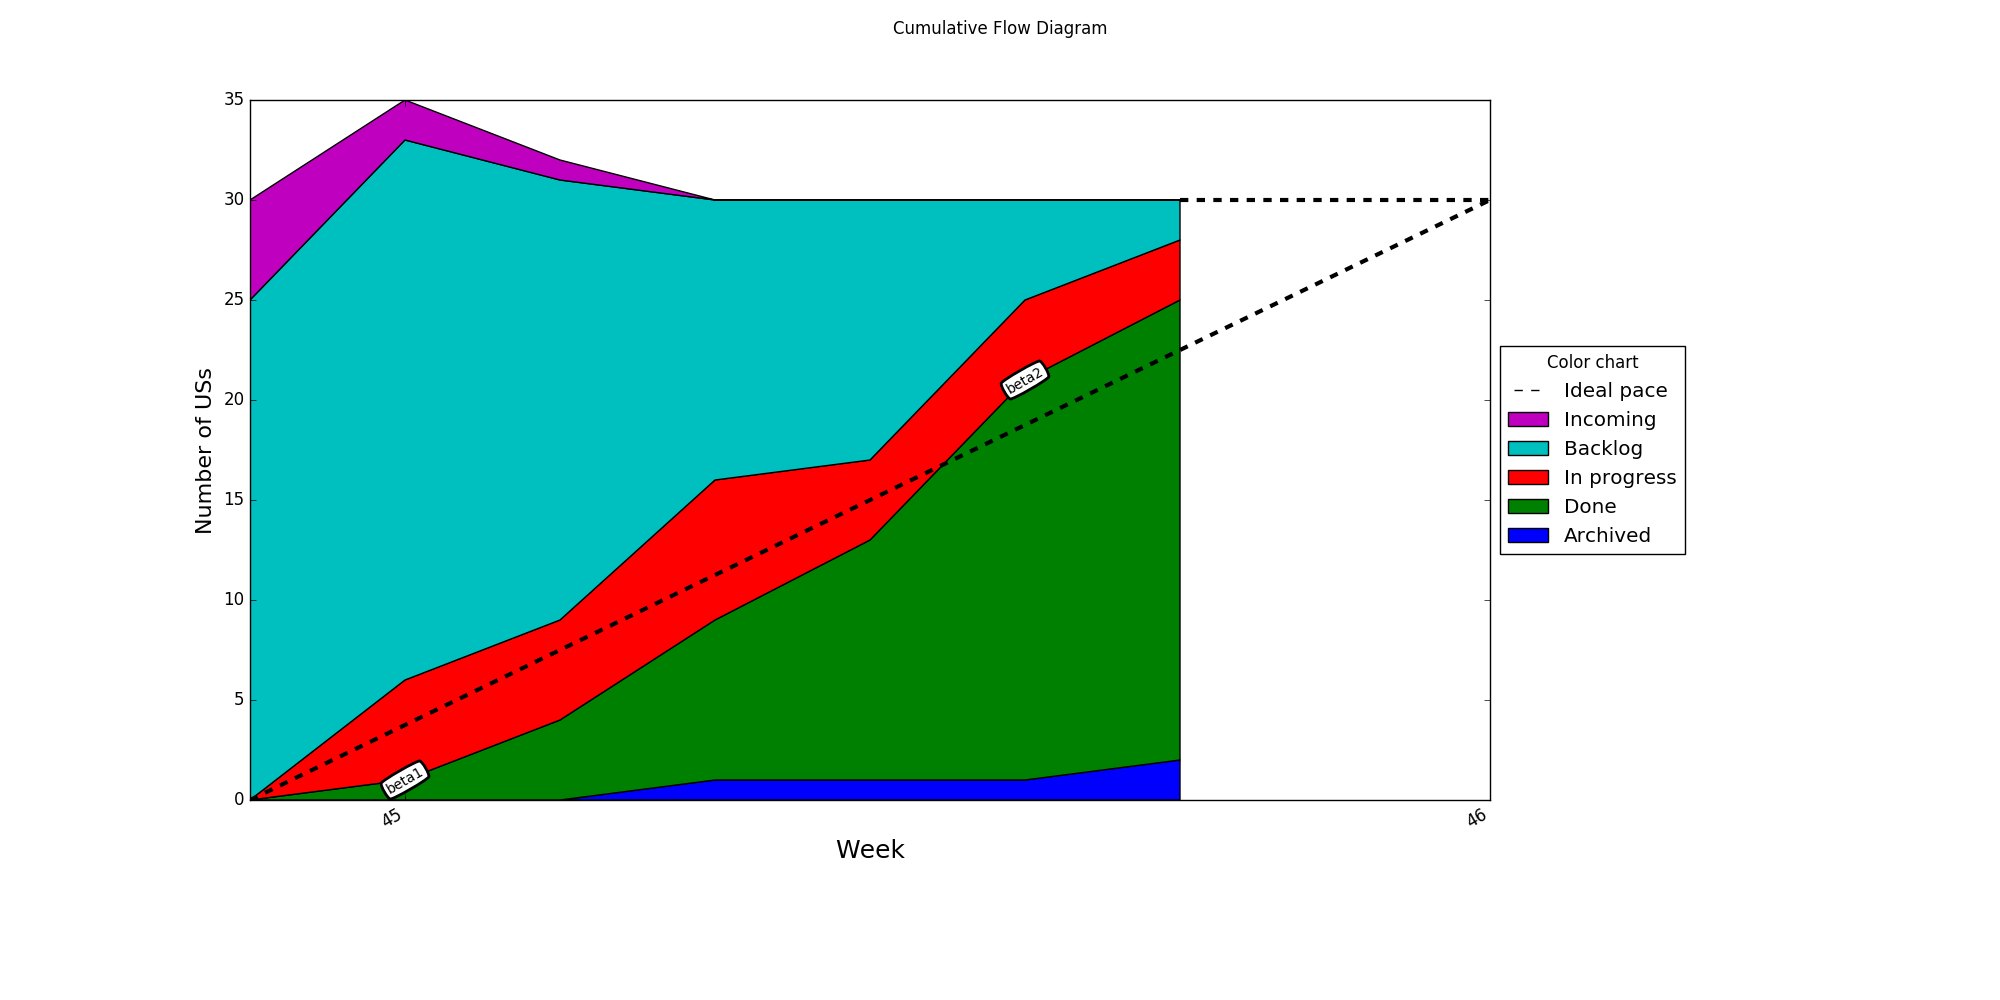
To save the data and generate the diagram each working day, I have this cron job:
```console
$ crontab -l | grep taiga
0 18 * * 1-5 $HOME/bin/taiga-stats-cron.sh
```
and the script `taiga-stats-cron.sh`:
```bash
#!/usr/bin/env sh
taiga-stats store_daily --tag some_feature_tag
taiga-stats cfd --tag some_feature_tag
```
## User Story Dependency Graph
Some stories require others to be completed before they can be started. I thought it would be handy if you could keep track of these dependencies in Taiga, but simply write for each US a list of other stories that this story depends on. Then from this information a [.dot file](https://github.com/erikw/taiga-stats/tree/main/sample_data/dependencies_example.dot) can be generated that should how you user stories depends on each other. This graph is very useful for work planning i.e. what to start with and how much parallelization is possible and at what stages.
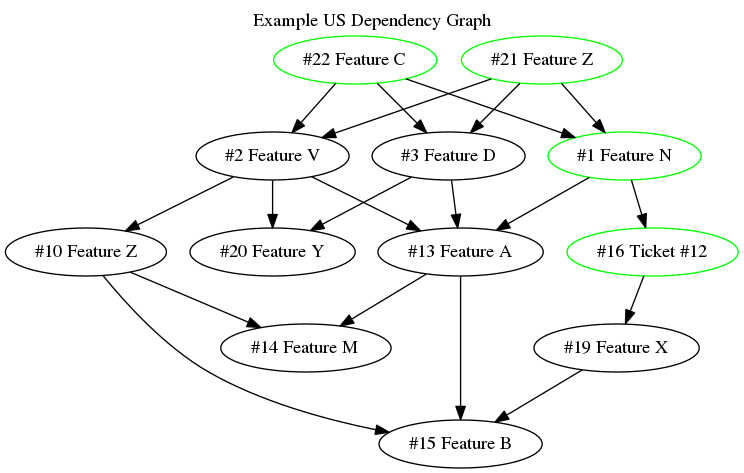
The stories that are marked as Done in Taiga have a green color in the graph.
### How to set up the dependency feature
First, create a new custom field in Taiga named `Depends On` under Settings > Attributes > Custom Fields:

Then go to your User Stories and enter some dependencies as demonstrated below.
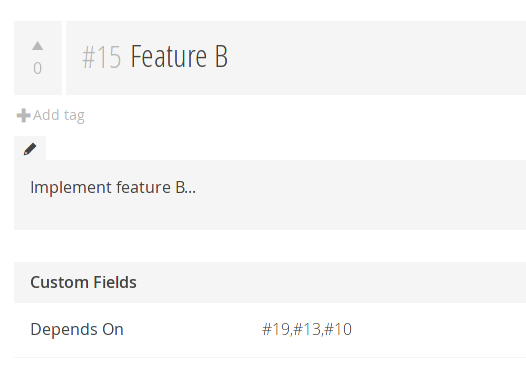
Then run the script and generate a PNG file.
```shell
taiga-stats deps_dot
dot -T png -o ./dependencies.png ./dependencies.dot
```
# Setup
## Installation
Make sure to use a supported Python version. See `project.requires-python` in [pyproject.toml](https://github.com/erikw/taiga-stats/blob/main/pyproject.toml).
```shell
pip install taiga-stats
taiga-stats -h
```
If you use [pipx](https://pypi.org/project/pipx/) to install, you must specify a supported and locally available Python version, like:
```shell
pipx install --python python3.11 taiga-stats
```
To use this tool, you need to supply
* `--url` to your taiga server e.g., `https://api.taiga.io/`
* `--auth-token` that you need to obtain according to the [official instructions](https://docs.taiga.io/api.html#_authentication).
It's recommended to put these 2 values in the below-described `taiga-stats.conf` file for easier usage of this tool!
## Config file
It is tedious to have to specify the server URL and the authentication token every time. Also, you typically work with one project at a time and would like to have default values for the project to use, and maybe which tag to filter on. You can generate a configuration file to set these default values.
```shell
taiga-stats config_template
mv ./taiga.conf.template ~/.taiga-stats.conf
vi ~/.taiga-stats.conf
```
# Development
* `uv` manages the project virtual environment in `.venv`, so you generally do not need to activate it manually. Use `uv run ...` for project commands.
* Reference for how to structure a Python project: <https://realpython.com/pypi-publish-python-package/>
## Setup from Git
* Clone this git
```shell
git clone https://github.com/erikw/taiga-stats.git && cd $(basename "$_" .git)
```
* Install uv
```shell
curl -LsSf https://astral.sh/uv/install.sh | sh
```
* Install project dependencies
```shell
uv sync --all-groups
```
* Dependency management
```shell
uv add <package>
uv add --group dev <package>
uv remove <package>
uv lock --upgrade
```
* Now taiga-stats should work!
```shell
uv run taiga-stats -h
# or
bin/taiga-stats.sh
```
* To install locally:
```shell
uv build
uv pip install dist/taiga_stats-*.whl
```
## Linting and Formatting
* Linting: Consider isort, flake8, and pylint as replaced by ruff.
* Formatting: Consider black as replaced by ruff.
```shell
uv run ruff check
uv run ruff format
```
## Documentation generation
```shell
uv run --group docs mkdocs serve
uv run --group docs mkdocs build
```
but `bin/gen_docs.sh` will take care of all that plus more!
# Releasing
```shell
bin/gen_docs.sh
vi CHANGELOG.md
uv version --bump minor && ver="v$(uv version --short)"
git commit -am "Bump version to $ver" && git tag "$ver" && git push --atomic origin main "$ver"
uv build
uv publish
```